There are a huge number of different types of raster data available. Some of these can be categorized as:
Topographic maps including 24k, 50k, and 100k, have been around for a long time and are still one of the best reference data sets. These images are not very attractive because they were actually "scanned" from paper copies of the maps. They are also going out of date and newer "Digital Line Graphic" versions are becoming available.
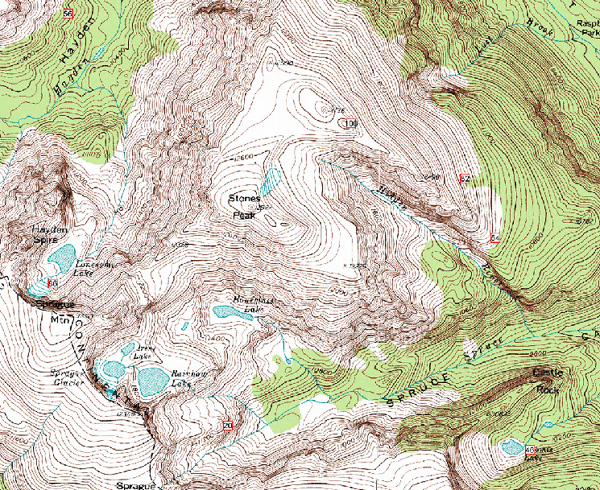
Topo maps can be downloaded from the USGS web site.
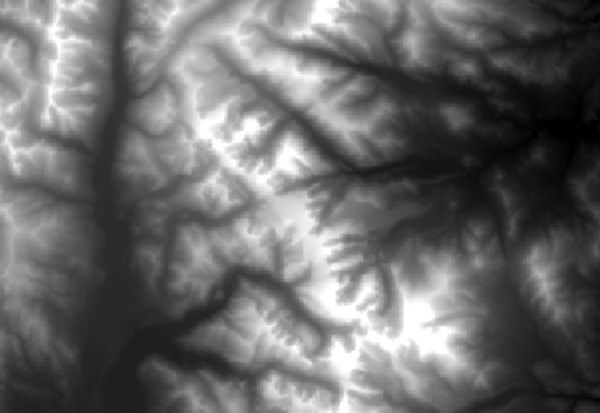
Digital Elevation Models (DEMs) are one of the most commonly used rasters for GIS folks and we'll be making other rasters from DEMs in just a bit.
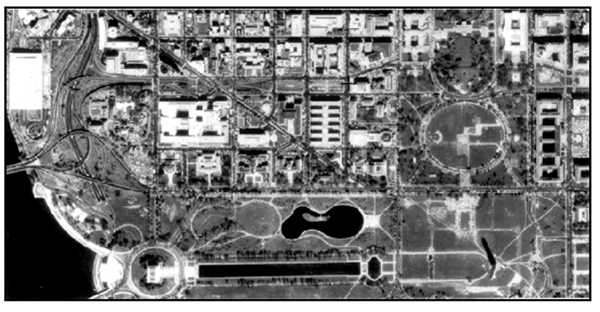
Digital Ortho Quarter Quads where black and white aerial photos that were taken periodically by the US government. These images have largely been replaced by sources such as NAIP but they still come in handy in remote areas. Below is an image of the capitol mall in Washington DC.
Landsat is one of the most valuable and commonly used data sets we have. The original Landsat satellite was launched in 1972 and there is over 50 years of data and it scans the entire earth twice a month. At 15 meters (panchromatic or black and white) and 30 meters (rgb or color).
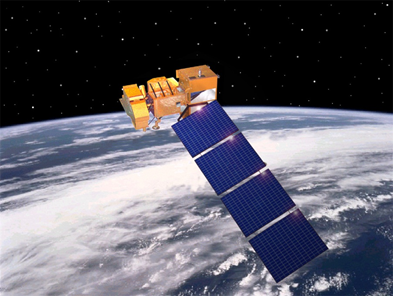
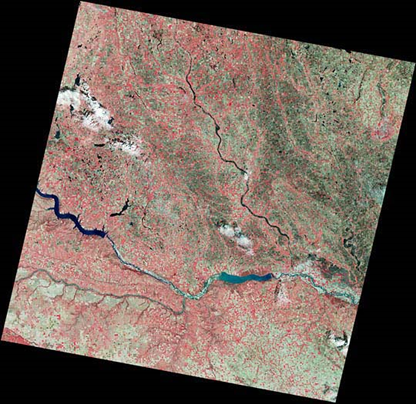
The LandSat satellite orbits the earth in a tilted polar orbit giving it the characteristic tilted images you may have seen before. Below is a sample LandSat scene that is shown the agricultural land highlighted by moving the infrared band to the red band.
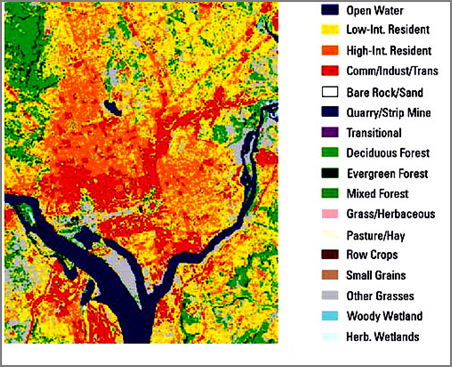
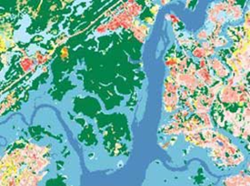
The National Land Cover Dataset (NLCD) classifies each 30 meter pixel in LandSat scenes to give us a code for each pixel. Below is a sample NLCD image for Washington DC. You can see that this is a high commercial and high intensity residential area with some open water.
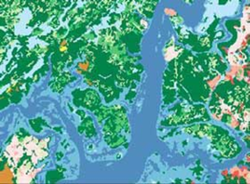
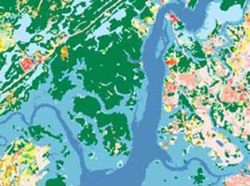
This dataset makes it very easy to perform operations such as change detection. Below are NLCD images for the same area over a 14 year period. You can see the increased human development over this period and the narrowing of the water ways.
| 1992 | 2001 | 2006 |
|---|---|---|
|
|
|
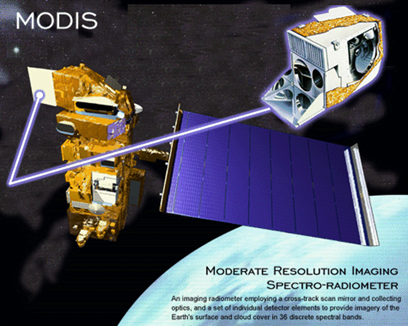
The Moderate Resolution Imaging Spectro-Radiometer sensor scans the entire earth at 250meters per pixel but twice a day.
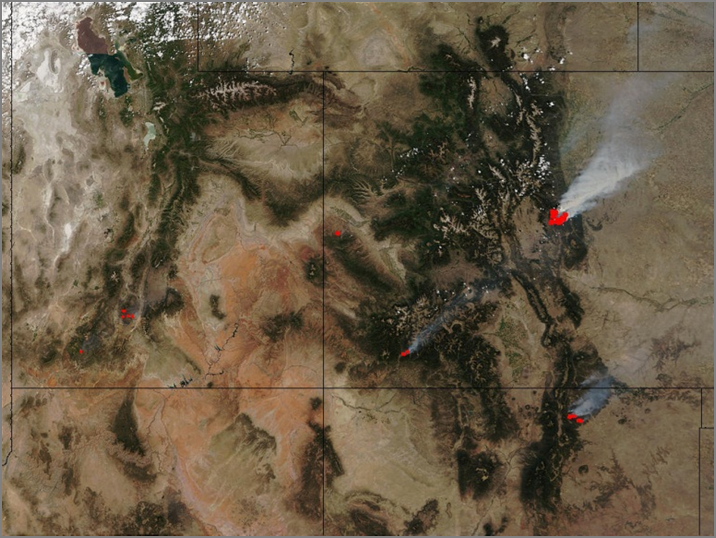
Below is a MODIS image of Utah and Colorado during serial large fires. The fires have been colorized red and because this data is available twice a day, MODIS quickly became part of fire fighting world-wide.
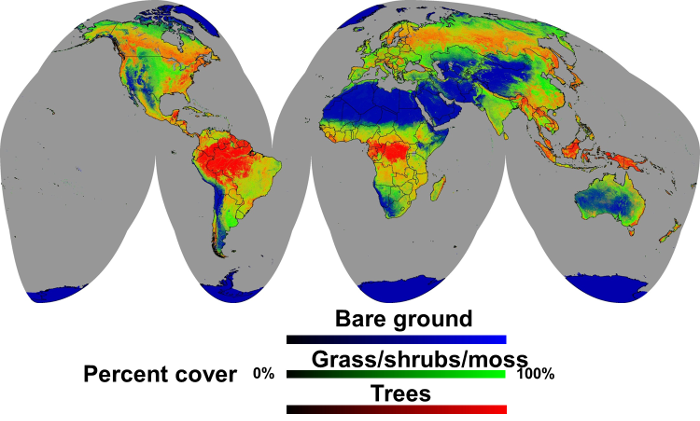
Below is a land cover map for MODIS at a global scale. MODIS and other satellites provide us with new data to create valuable derived layers to see portions of the earth or the entire earth in a way that could not be imaged by our grand parents.
© Copyright 2018 HSU - All rights reserved.